

Charted: The World’s Aging Population from 1950 to 2100
As demographics continue to shift in the 21st century, the world’s aging population will continue to be a focal point for many global decision makers.
Most countries around the world have experienced population explosions, or are about to. Combine this with declining birth rates and falling mortality rates, and it’s clear that the global senior population will continue to reach new heights.
These graphics by Pablo Alvarez use data from the 2022 UN World Population Prospects to visualize this increasing aging population across countries.
The World’s Aging Population from 1950 to 2100
In 2022, there were 771 million people aged 65+ years globally, accounting for almost 10% of the world’s population.
This segment has been growing at an increasing rate, and it’s expected to hit 16% in 2050, and eventually 24% by 2100. Here’s what that’s projected to look like, for every country and territory.Search:
| Country by Population Aged +65 Years | 1950 | 2022 | 2100 |
|---|---|---|---|
 Afghanistan Afghanistan | 2.85% | 2.39% | 16.03% |
 Albania Albania | 6.04% | 16.66% | 49.08% |
 Algeria Algeria | 3.49% | 6.39% | 28.83% |
 American Samoa American Samoa | 2.38% | 7.27% | 45.41% |
 Andorra Andorra | 10.02% | 14.98% | 37.04% |
 Angola Angola | 2.93% | 2.6% | 12.07% |
 Anguilla Anguilla | 3.69% | 10.71% | 37.49% |
 Antigua and Barbuda Antigua and Barbuda | 4.14% | 10.63% | 35.4% |
 Argentina Argentina | 4.13% | 11.92% | 31.79% |
 Armenia Armenia | 8.17% | 13.15% | 36.13% |
| 🌐 World | 5.13% | 9.82% | 24.03% |
Showing 1 to 10 of 236 entries
Some of the places with high elderly shares today include high-income countries like Japan (30%), Italy (24%), and Finland (23%).
The lowest shares are concentrated in the Middle East and Africa. Many countries have just 2% of their population aged 65 years and older, such as Qatar, Uganda, and Afghanistan.
But over time, almost all countries are expected to see their older population segments grow. In just three decades, it is estimated that one-in-four European, North American, and Asian residents will be over 65 years of age.
By 2100, a variety of Asian countries and island nations facing low population growth are expected to see more than one-third of their populations aged 65 years or older, including South Korea and Jamaica at 44%. However, it’s actually Albania that’s the biggest outlier overall, with a projected 49% of its population to be aged 65 and older by 2100.
Passing the Generational Torch
The challenge of an aging population is set to impact all sectors of society, including labor and financial markets, demand for housing and transportation, and especially family structures and intergenerational ties.
One way to help grasp the nature of transition is to note the changing ratio between seniors and young children in the world population, as seen in the below crossover diagram:
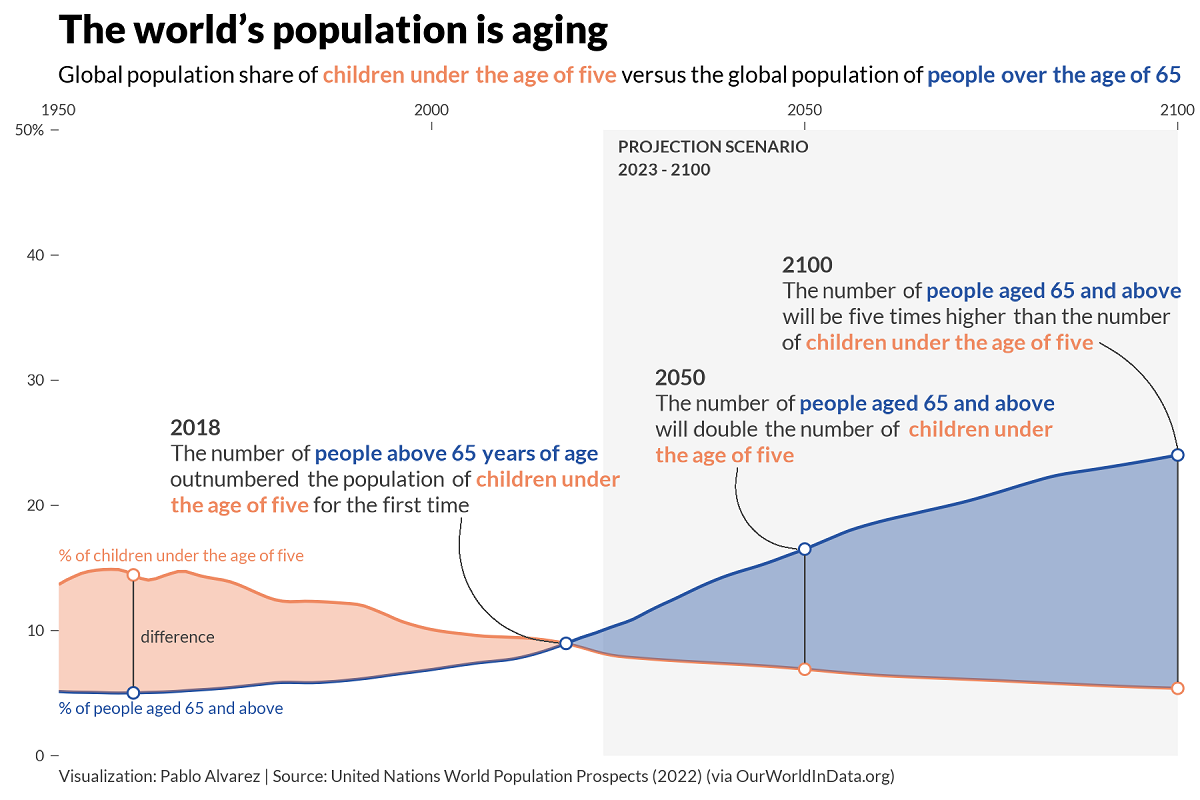
Dropping fertility rates, in addition to improved child and infant mortality rates, are known to have played a major role in the plateauing population of children.
However, not all countries have witnessed this crossover yet, as it usually coincides with higher levels of economic development.
As countries such as India, Brazil, and South Africa reach higher levels of per capita income, they will be likely to follow down the paths of more advanced economies, eventually experiencing similar demographic fates and challenges.
