

When uranium was discovered in 1789 by Martin Heinrich Klaproth, it’s likely the German chemist didn’t know how important the element would become to human life.
Used minimally in glazing and ceramics, uranium was originally mined as a byproduct of producing radium until the late 1930s. However, the discovery of nuclear fission, and the potential promise of nuclear power, changed everything.
What’s the current state of the uranium mining industry? This series of charts from Truman Du highlights production and the use of uranium using 2021 data from the World Nuclear Association (WNA) and Our World in Data.
Who are the Biggest Uranium Miners in the World?
Most of the world’s biggest uranium suppliers are based in countries with the largest uranium deposits, like Australia, Kazakhstan, and Canada.
The largest of these companies is Kazatomprom, a Kazakhstani state-owned company that produced 25% of the world’s new uranium supply in 2021.
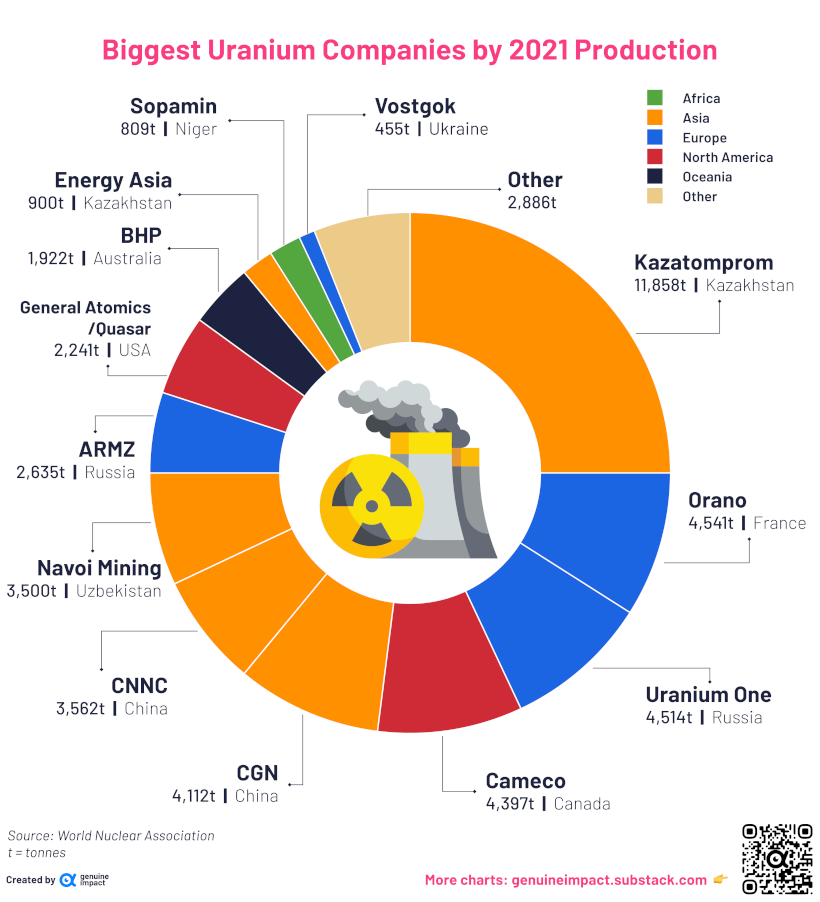
As seen in the above chart, 94% of the roughly 48,000 tonnes of uranium mined globally in 2021 came from just 13 companies.Search:
| Rank | Company | 2021 Uranium Production (tonnes) | Percent of Total |
|---|---|---|---|
| 1 |  Kazatomprom Kazatomprom | 11,858 | 25% |
| 2 |  Orano Orano | 4,541 | 9% |
| 3 |  Uranium One Uranium One | 4,514 | 9% |
| 4 |  Cameco Cameco | 4,397 | 9% |
| 5 |  CGN CGN | 4,112 | 9% |
| 6 |  Navoi Mining Navoi Mining | 3,500 | 7% |
| 7 | CNNC | 3,562 | 7% |
| Total | 48,332 | 100% |
Showing 1 to 7 of 14 entries
France’s Orano, another state-owned company, was the world’s second largest producer of uranium at 4,541 tonnes.
Companies rounding out the top five all had similar uranium production numbers to Orano, each contributing around 9% of the global total. Those include Uranium One from Russia, Cameco from Canada, and CGN in China.
Where are the Largest Uranium Mines Found?
The majority of uranium deposits around the world are found in 16 countries with Australia, Kazakhstan, and Canada accounting for for nearly 40% of recoverable uranium reserves.
But having large reserves doesn’t necessarily translate to uranium production numbers. For example, though Australia has the biggest single deposit of uranium (Olympic Dam) and the largest reserves overall, the country ranks fourth in uranium supplied, coming in at 9%.
Here are the top 10 uranium mines in the world, accounting for 53% of the world’s supply.
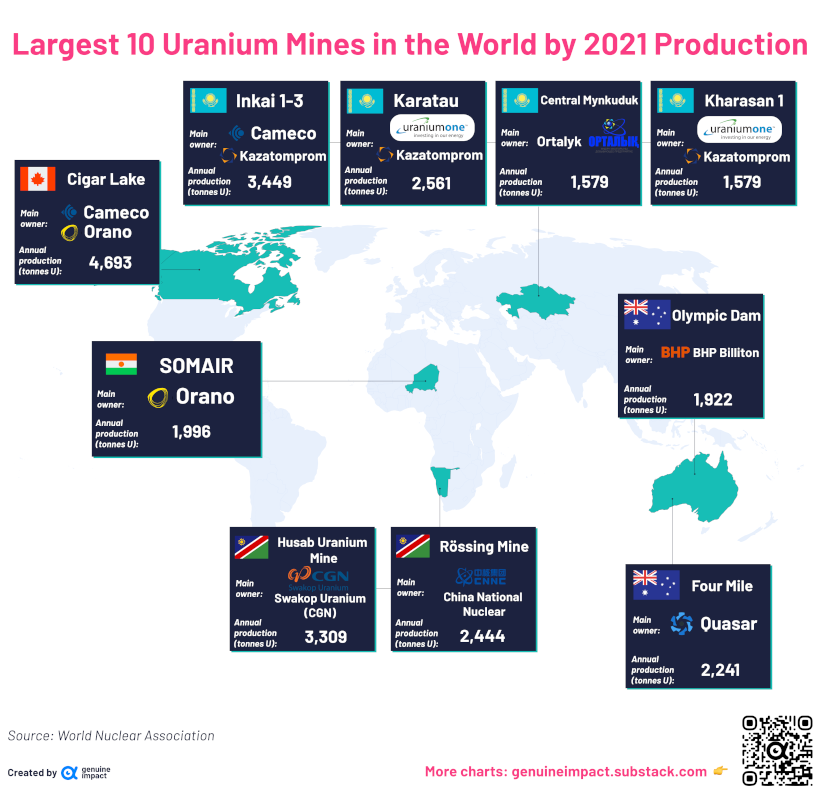
Of the largest mines in the world, four are found in Kazakhstan. Altogether, uranium mined in Kazakhstan accounted for 45% of the world’s uranium supply in 2021.
| Uranium Mine | Country | Main Owner | 2021 Production |
|---|---|---|---|
| Cigar Lake | Canada | Cameco/Orano | 4,693t |
| Inkai 1-3 | Kazakhstan | Kazaktomprom/Cameco | 3,449t |
| Husab |  Namibia Namibia | Swakop Uranium (CGN) | 3,309t |
| Karatau (Budenovskoye 2) | Kazakhstan | Uranium One/Kazatomprom | 2,561t |
| Rössing | Namibia | CNNC | 2,444t |
| Four Mile |  Australia Australia | Quasar | 2,241t |
| SOMAIR |  Niger Niger | Orano | 1,996t |
| Olympic Dam | Australia | BHP Billiton | 1,922t |
| Central Mynkuduk | Kazakhstan | Ortalyk | 1,579t |
| Kharasan 1 | Kazakhstan | Kazatomprom/Uranium One | 1,579t |
Namibia, which has two of the five largest uranium mines in operation, is the second largest supplier of uranium by country, at 12%, followed by Canada at 10%.
Interestingly, the owners of these mines are not necessarily local. For example, France’s Orano operates mines in Canada and Niger. Russia’s Uranium One operates mines in Kazakhstan, the U.S., and Tanzania. China’s CGN owns mines in Namibia.
And despite the African continent holding a sizable amount of uranium reserves, no African company placed in the top 10 biggest companies by production. Sopamin from Niger was the highest ranked at #12 with 809 tonnes mined.
Uranium Mining and Nuclear Energy
Uranium mining has changed drastically since the first few nuclear power plants came online in the 1950s.
For 30 years, uranium production grew steadily due to both increasing demand for nuclear energy and expanding nuclear arsenals, eventually peaking at 69,692 tonnes mined in 1980 at the height of the Cold War.
Nuclear energy production (measured in terawatt-hours) also rose consistently until the 21st century, peaking in 2001 when it contributed nearly 7% to the world’s energy supply. But in the years following, it started to drop and flatline.
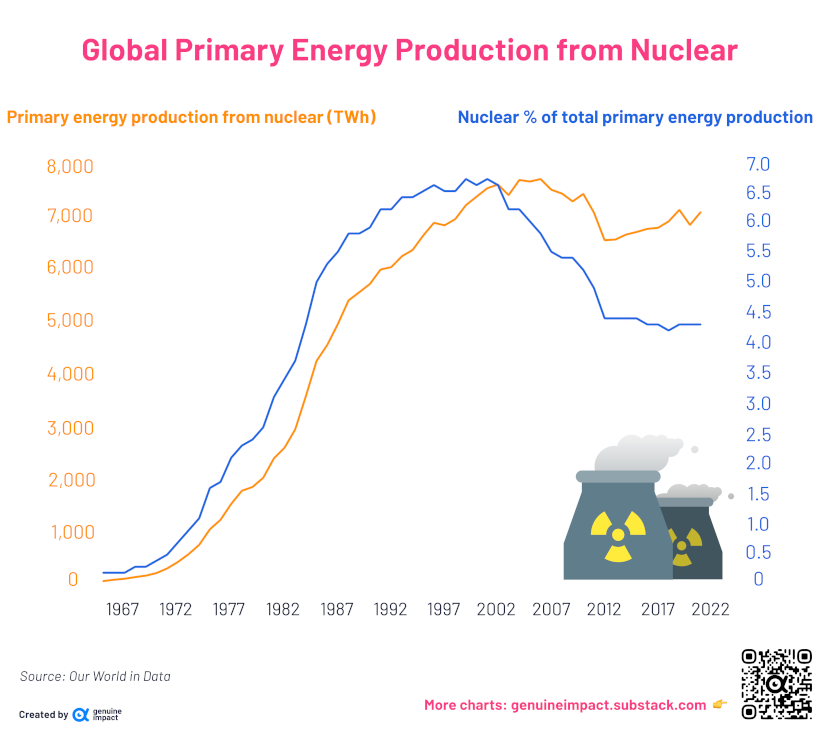
By 2021, nuclear energy had fallen to 4.3% of global energy production. Several nuclear accidents—Chernobyl, Three Mile Island, and Fukushima—contributed to turning sentiment against nuclear energy.
| Year | Nuclear Energy Production | % of Total Energy |
|---|---|---|
| 1965 | 72 TWh | 0.2% |
| 1966 | 98 TWh | 0.2% |
| 1967 | 116 TWh | 0.2% |
| 1968 | 148 TWh | 0.3% |
| 1969 | 175 TWh | 0.3% |
| 1970 | 224 TWh | 0.4% |
| 1971 | 311 TWh | 0.5% |
| 1972 | 432 TWh | 0.7% |
| 1973 | 579 TWh | 0.9% |
| 1974 | 756 TWh | 1.1% |
Showing 1 to 10 of 57 entries
More recently, a return to nuclear energy has gained some support as countries push for transitions to cleaner energy, since nuclear power generates no direct carbon emissions.
What’s Next for Nuclear Energy?
Nuclear remains one of the least harmful sources of energy, and some countries are pursuing advancements in nuclear tech to fight climate change.
Small, modular nuclear reactors are one of the current proposed solutions to both bring down costs and reduce construction time of nuclear power plants. The benefits include smaller capital investments and location flexibility by trading off energy generation capacity.
With countries having to deal with aging nuclear reactors and climate change at the same time, replacements need to be considered. Will they come in the form of new nuclear power and uranium mining, or alternative sources of energy?
